

Choose a metric
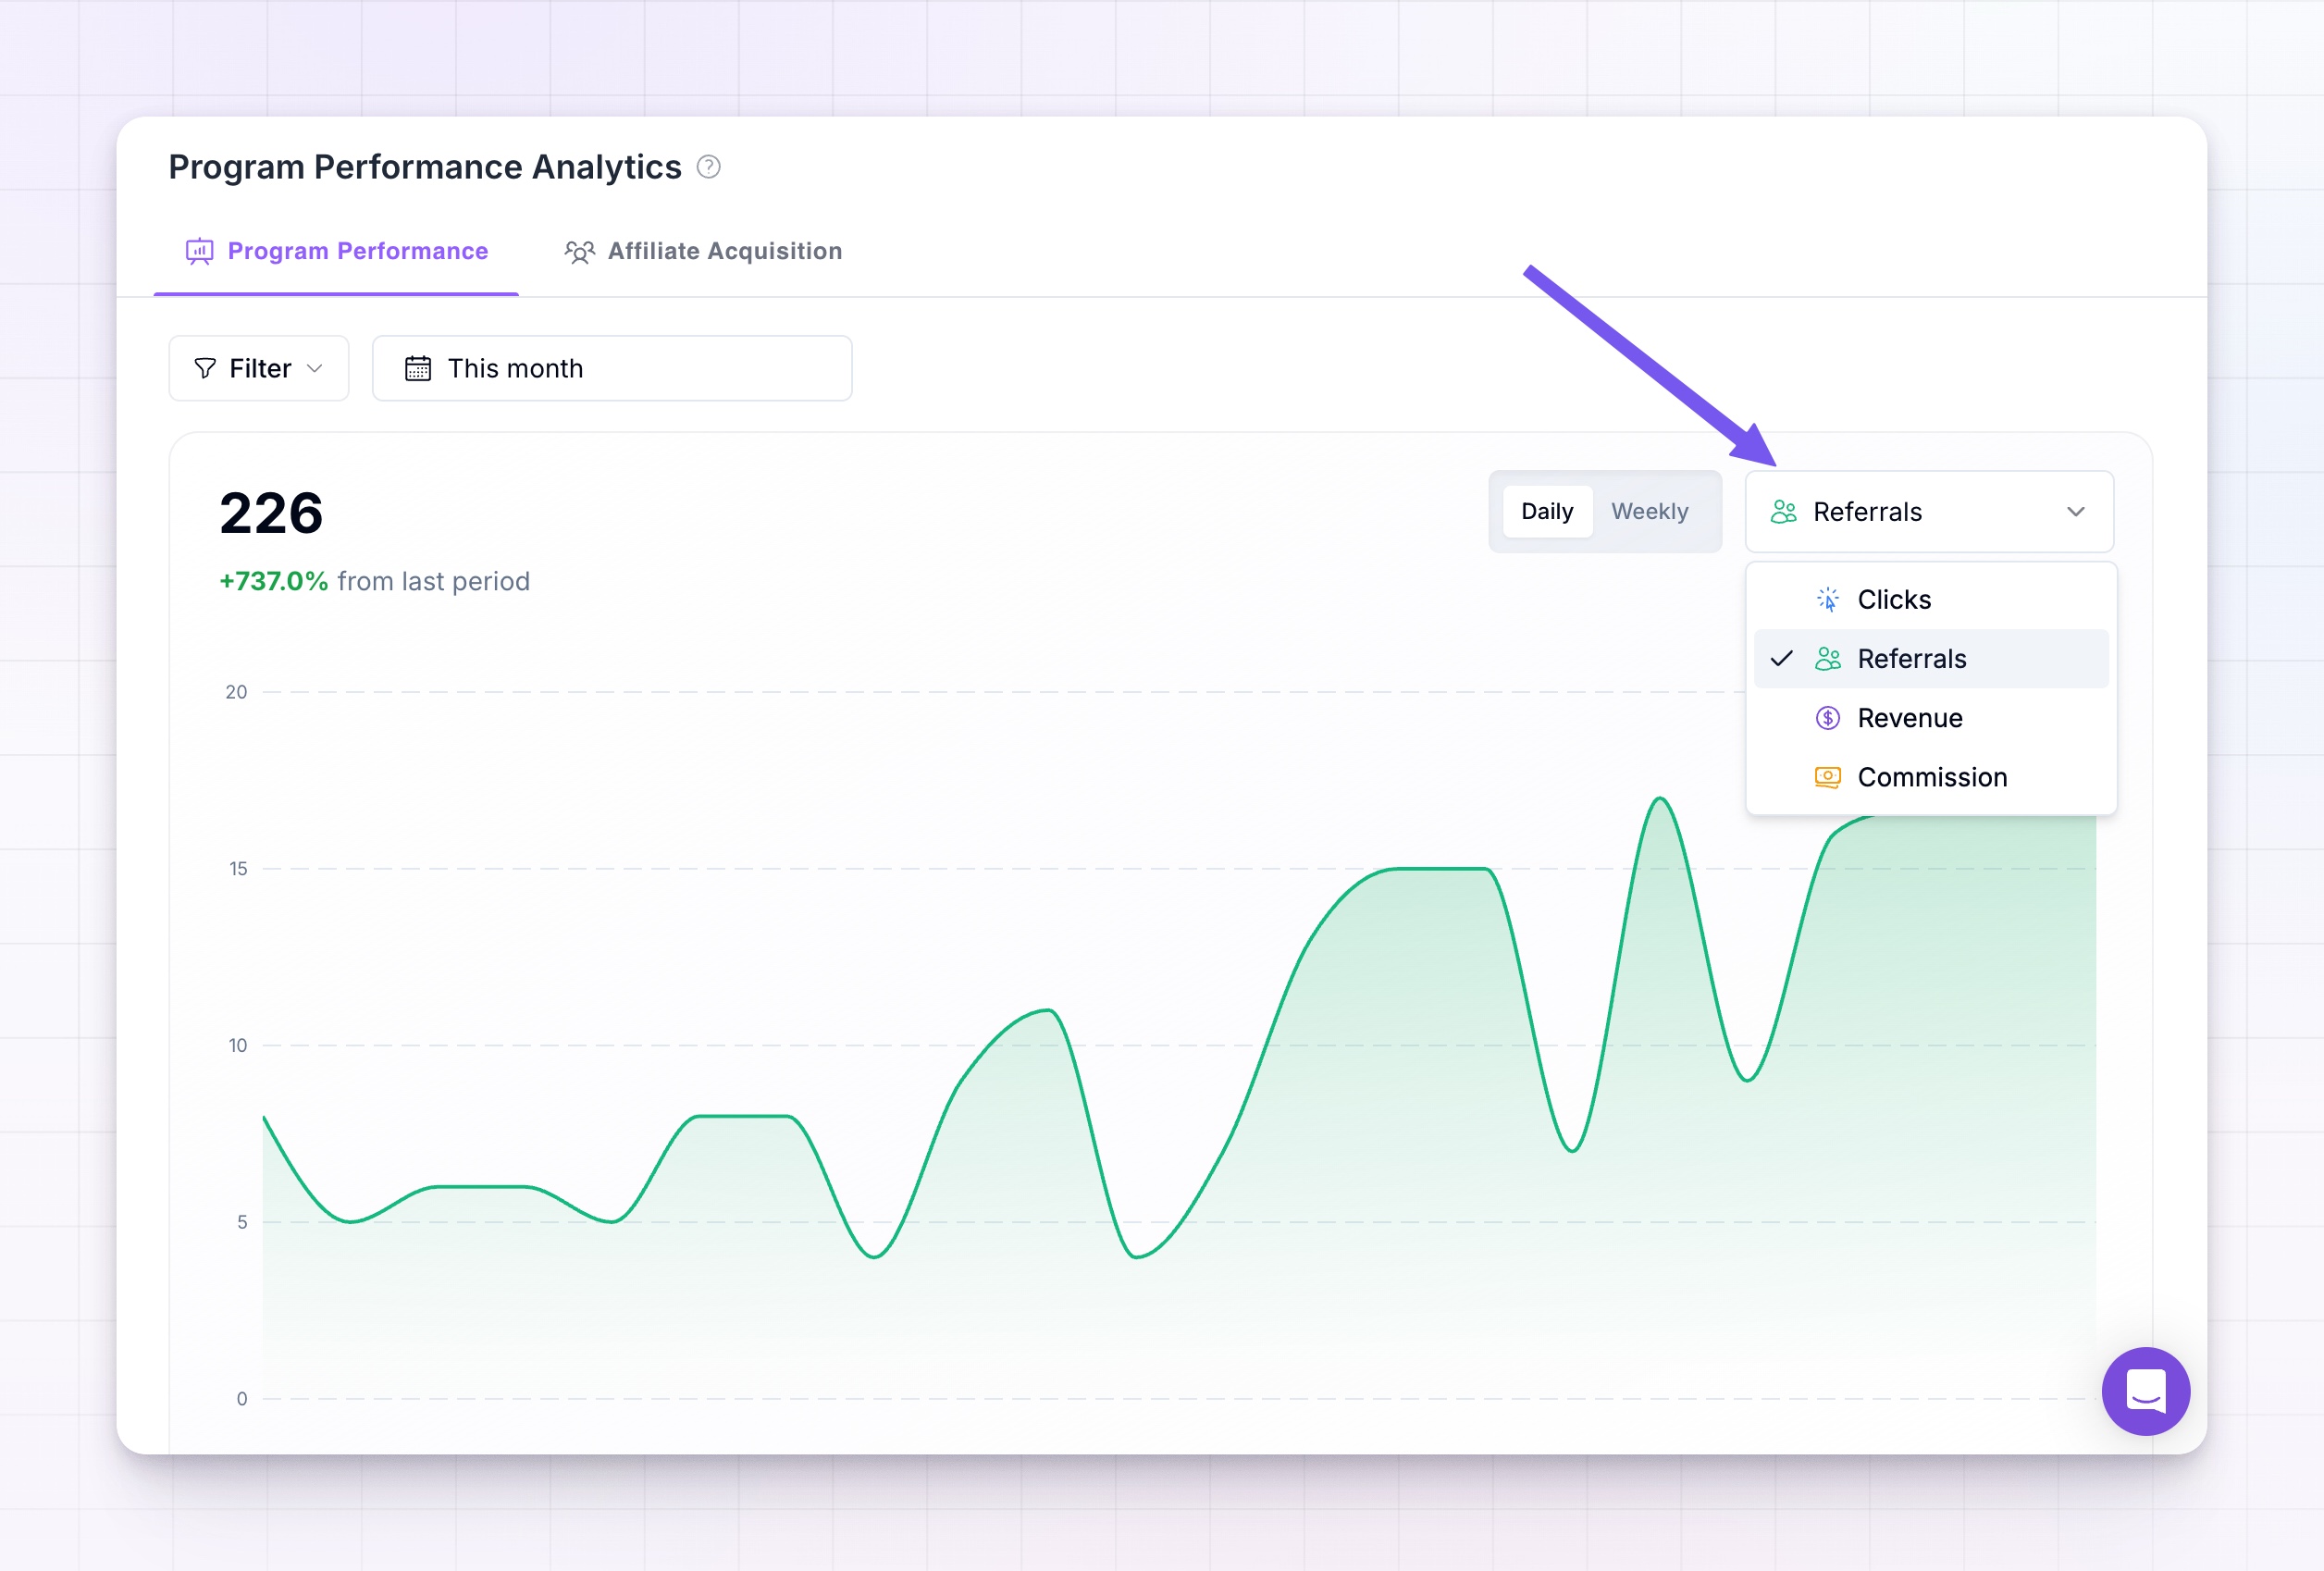
At the top of the tab is one large number for the metric you’re looking at, with a chart plotting it over time underneath. Use the dropdown on the right to switch between the four metrics:- Clicks — how many times your affiliates’ links were clicked.
- Referrals — how many customers those clicks turned into.
- Revenue — the sales your affiliates drove.
- Commission — what your affiliates earned on those sales.
Compare to the last period
Just below the big number, you’ll see a percentage with “from last period” next to it. This compares your current total to the period right before it — for example, if you’re looking at the last 7 days, it compares them to the 7 days before that. Green means the metric went up, red means it went down, so you can tell at a glance whether things are trending in the right direction.Split clicks into all or unique
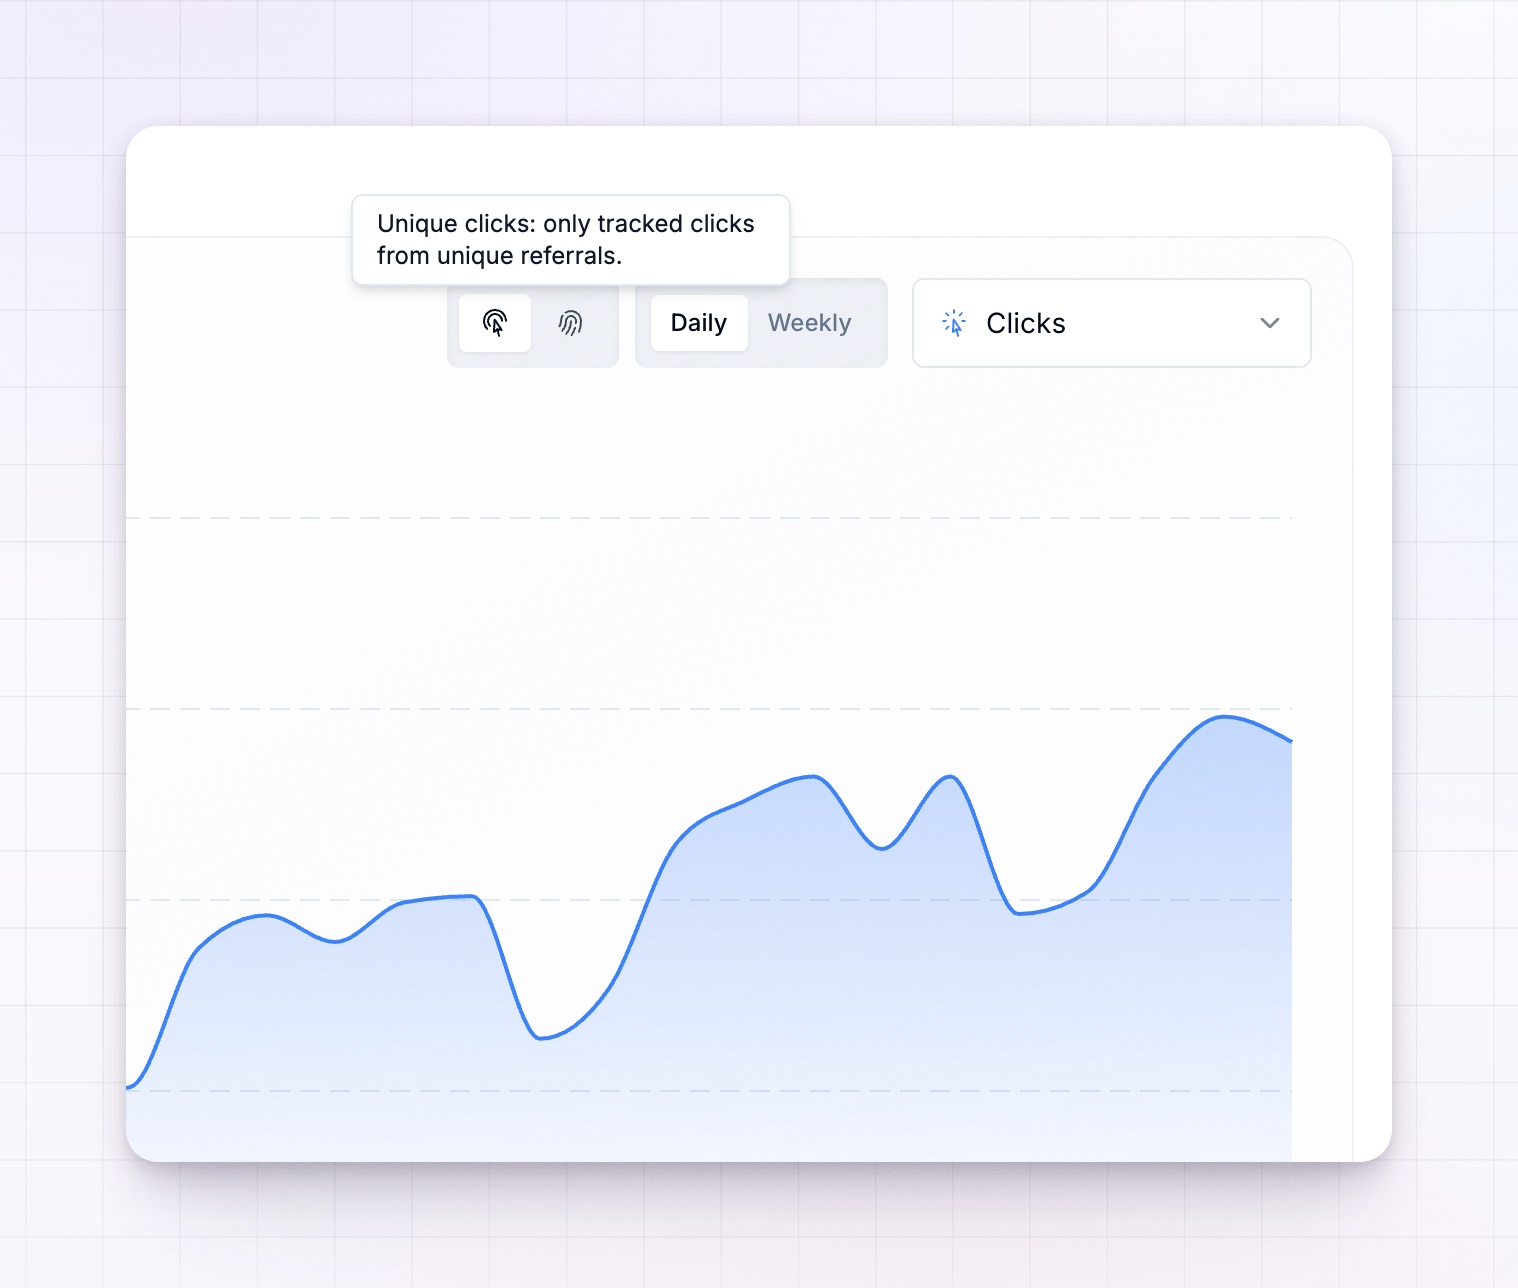
When Clicks is the selected metric, a small toggle appears with two options:- All clicks — every tracked click in the period, including repeat clicks from the same person.
- Unique clicks — only counts one click per unique visitor.
Split revenue into new or recurring
When Revenue is the selected metric, a toggle lets you separate first-time sales from repeat ones:- All revenue — every sale in the period.
- New revenue — only each referred customer’s first-ever purchase.
- Recurring revenue — the follow-on sales after a customer’s first purchase, such as subscription renewals.
Read the breakdown cards
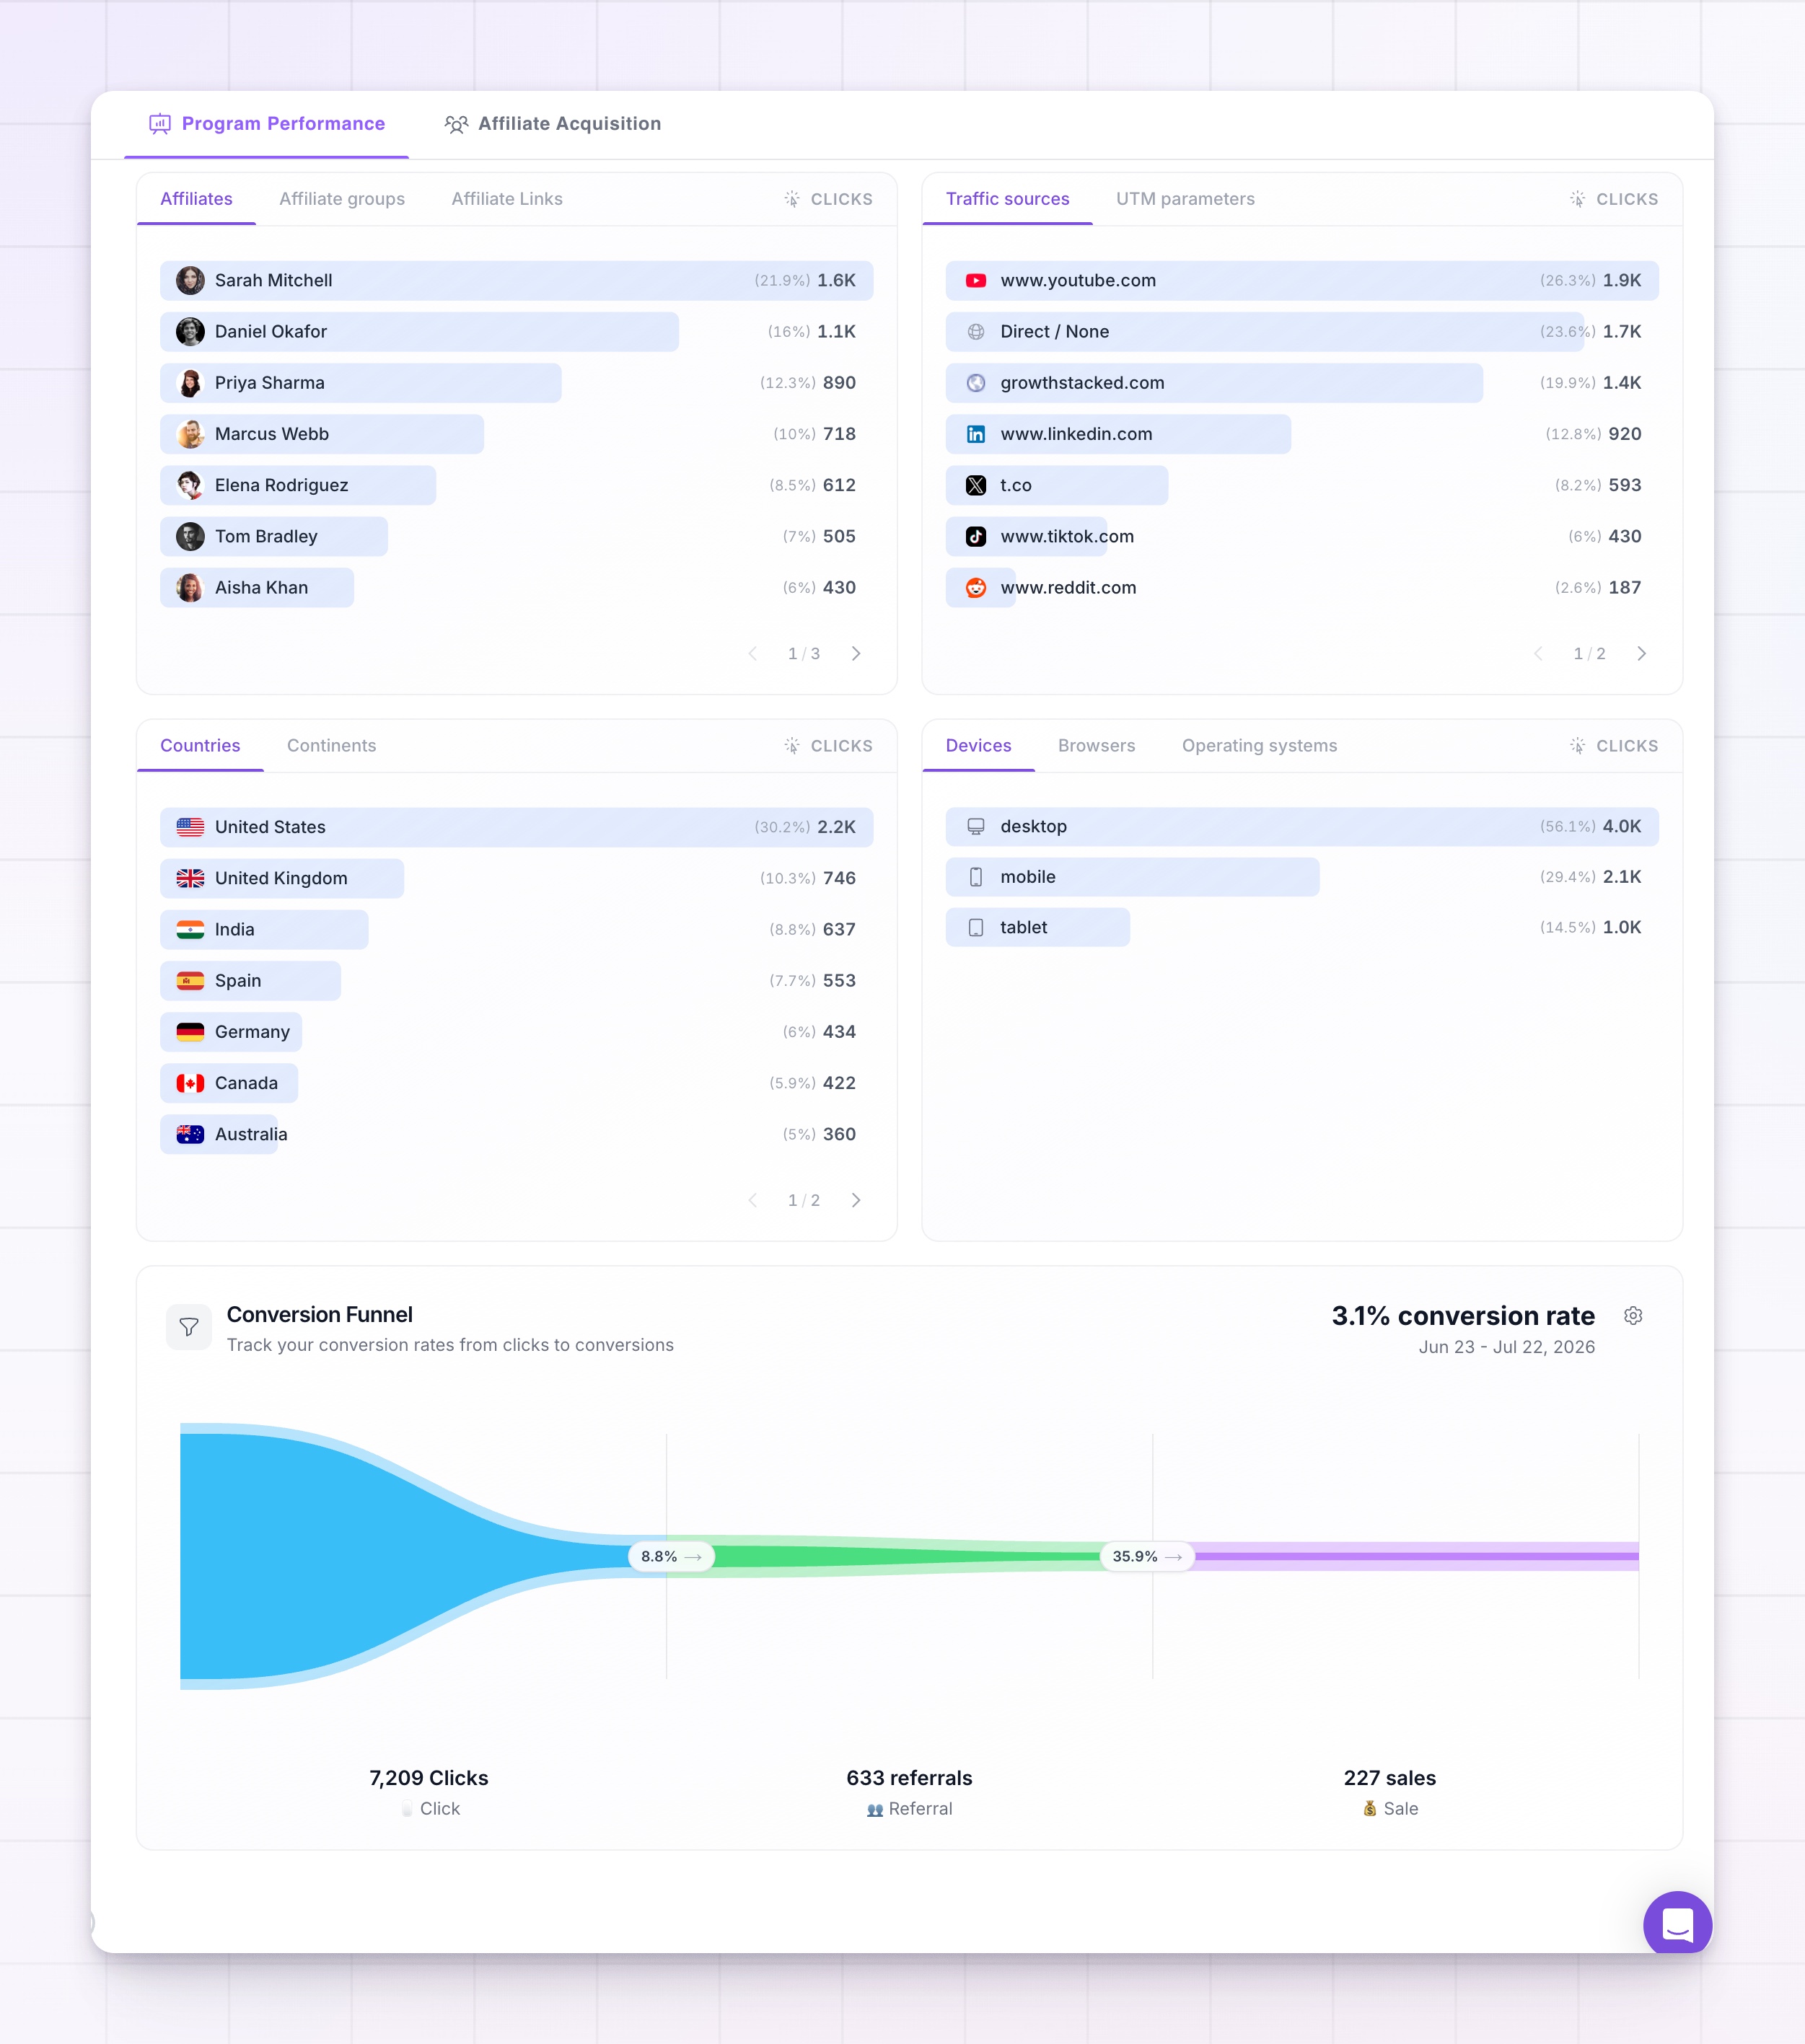
Below the chart, a set of cards breaks the selected metric down so you can see exactly what’s behind the totals. Each card has tabs across the top to switch between related views:- Affiliates, Affiliate groups, and Affiliate Links — who is driving the metric, which groups they belong to, and which specific links are performing.
- Traffic sources and UTM parameters — where the clicks are coming from, and how they break down by UTM source, medium, campaign, term, and content.
- Countries and Continents — where in the world your traffic and sales come from.
- Devices, Browsers, and Operating systems — what people are using when they click.
Drill into a single value
Any bar in a breakdown card is clickable. Select one — say a single affiliate, country, or device — and the whole page filters down to just that value, so every number, the chart, and the other cards all update to reflect it. It’s the quickest way to go from a top-line number to the story behind it. To layer several filters, or to filter by something that isn’t shown as a bar, use the Filter button at the top of the page. Your filters stay applied as you switch metrics and change the date range.See the full journey to a sale
Below the breakdown cards sits the conversion funnel, which shows how visitors move from a click through to a completed sale and where they drop off along the way. It has its own guide — see Conversion funnel.Related
Analytics overview
A tour of the whole Analytics area.
Conversion funnel
Follow visitors from click through to sale.
Affiliate acquisition
See where your affiliates come from and how they onboard.
Date ranges and granularity
Change the period and resolution of your charts.