

What counts as a delivery
A delivery succeeds when your endpoint returns a2xx status within the request timeout.
Everything else is a failure:
Two consequences catch people out.
A rejected signature is a failure. When your handler returns
400 because verification did not
pass, that is a failed delivery like any other and it enters the retry cycle. That is the behaviour
you want — a legitimate message rejected by a bug is retried, giving you a window to fix it. See
Verify signatures.
A slow success is a failure. If your handler does the work before responding and that work takes
longer than the timeout, the delivery fails even though your code ran to completion. You then get
retried and run the work again. Acknowledge first, process afterwards.
Retries
Failed deliveries are retried automatically on an exponential backoff, spread over roughly the following day:
That spread is deliberate: a deploy, a restart, or a brief database outage resolves inside the first
few attempts with no action from you.
The Attempts tab on a message is the authoritative record of what actually happened to that
message. Read it rather than inferring from the schedule above.
Read the delivery log
Open your campaign, go to Settings, then Advanced, then Webhooks, and select the Logs tab. It lists every message for the program, newest first, with the event type, the message ID, the timestamp, and a status badge.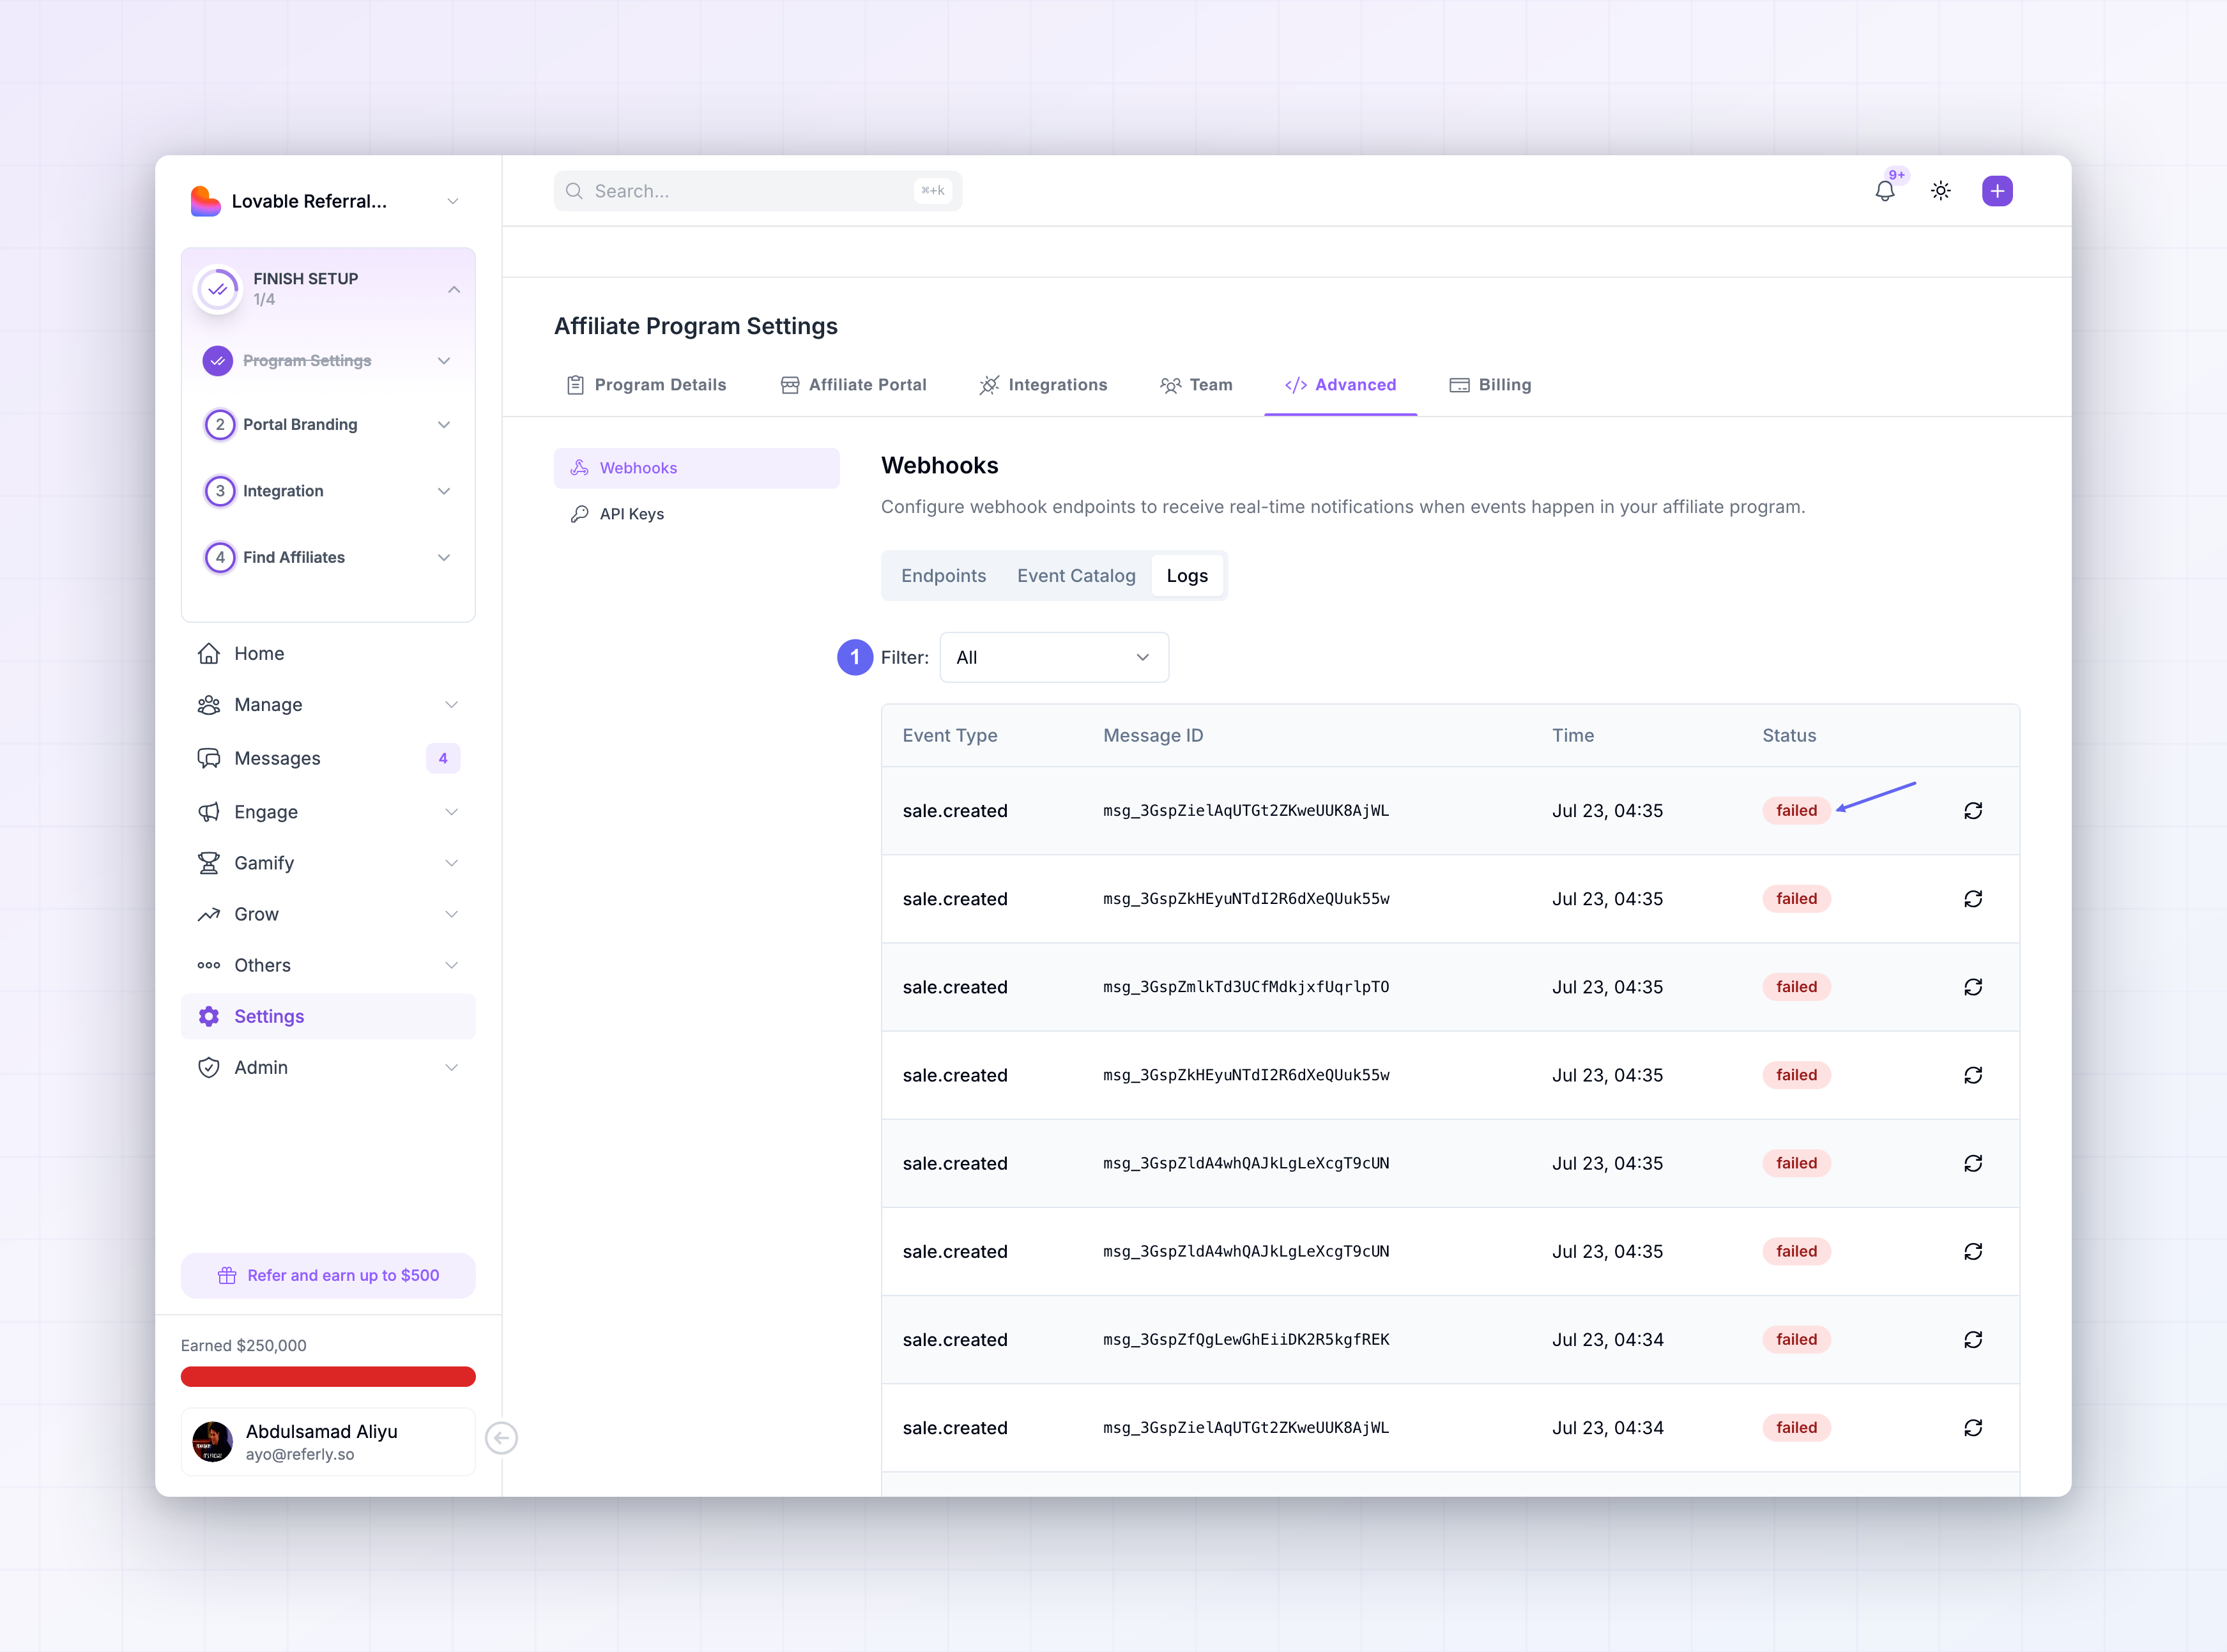 Statuses you will see:
Use the Filter dropdown to narrow to Succeeded or Failed. Filtering to Failed is the
fastest health check you have — a healthy integration shows an empty or near-empty list.
The message ID shown here is the same value your handler received as the
svix-id header, so you can
paste an ID from your own logs and find the exact delivery.
Inspect a single message
Select a row to open it. There are two tabs. Message shows Message Content — the JSON payload exactly as it was sent, in an expandable viewer — along with the Event Type. This is what your handler received, byte for byte, which makes it the place to confirm whether a field you expected was actually present. Attempts lists every delivery attempt for this message, with Status, the destination URL, the Timestamp, and the HTTP Response code.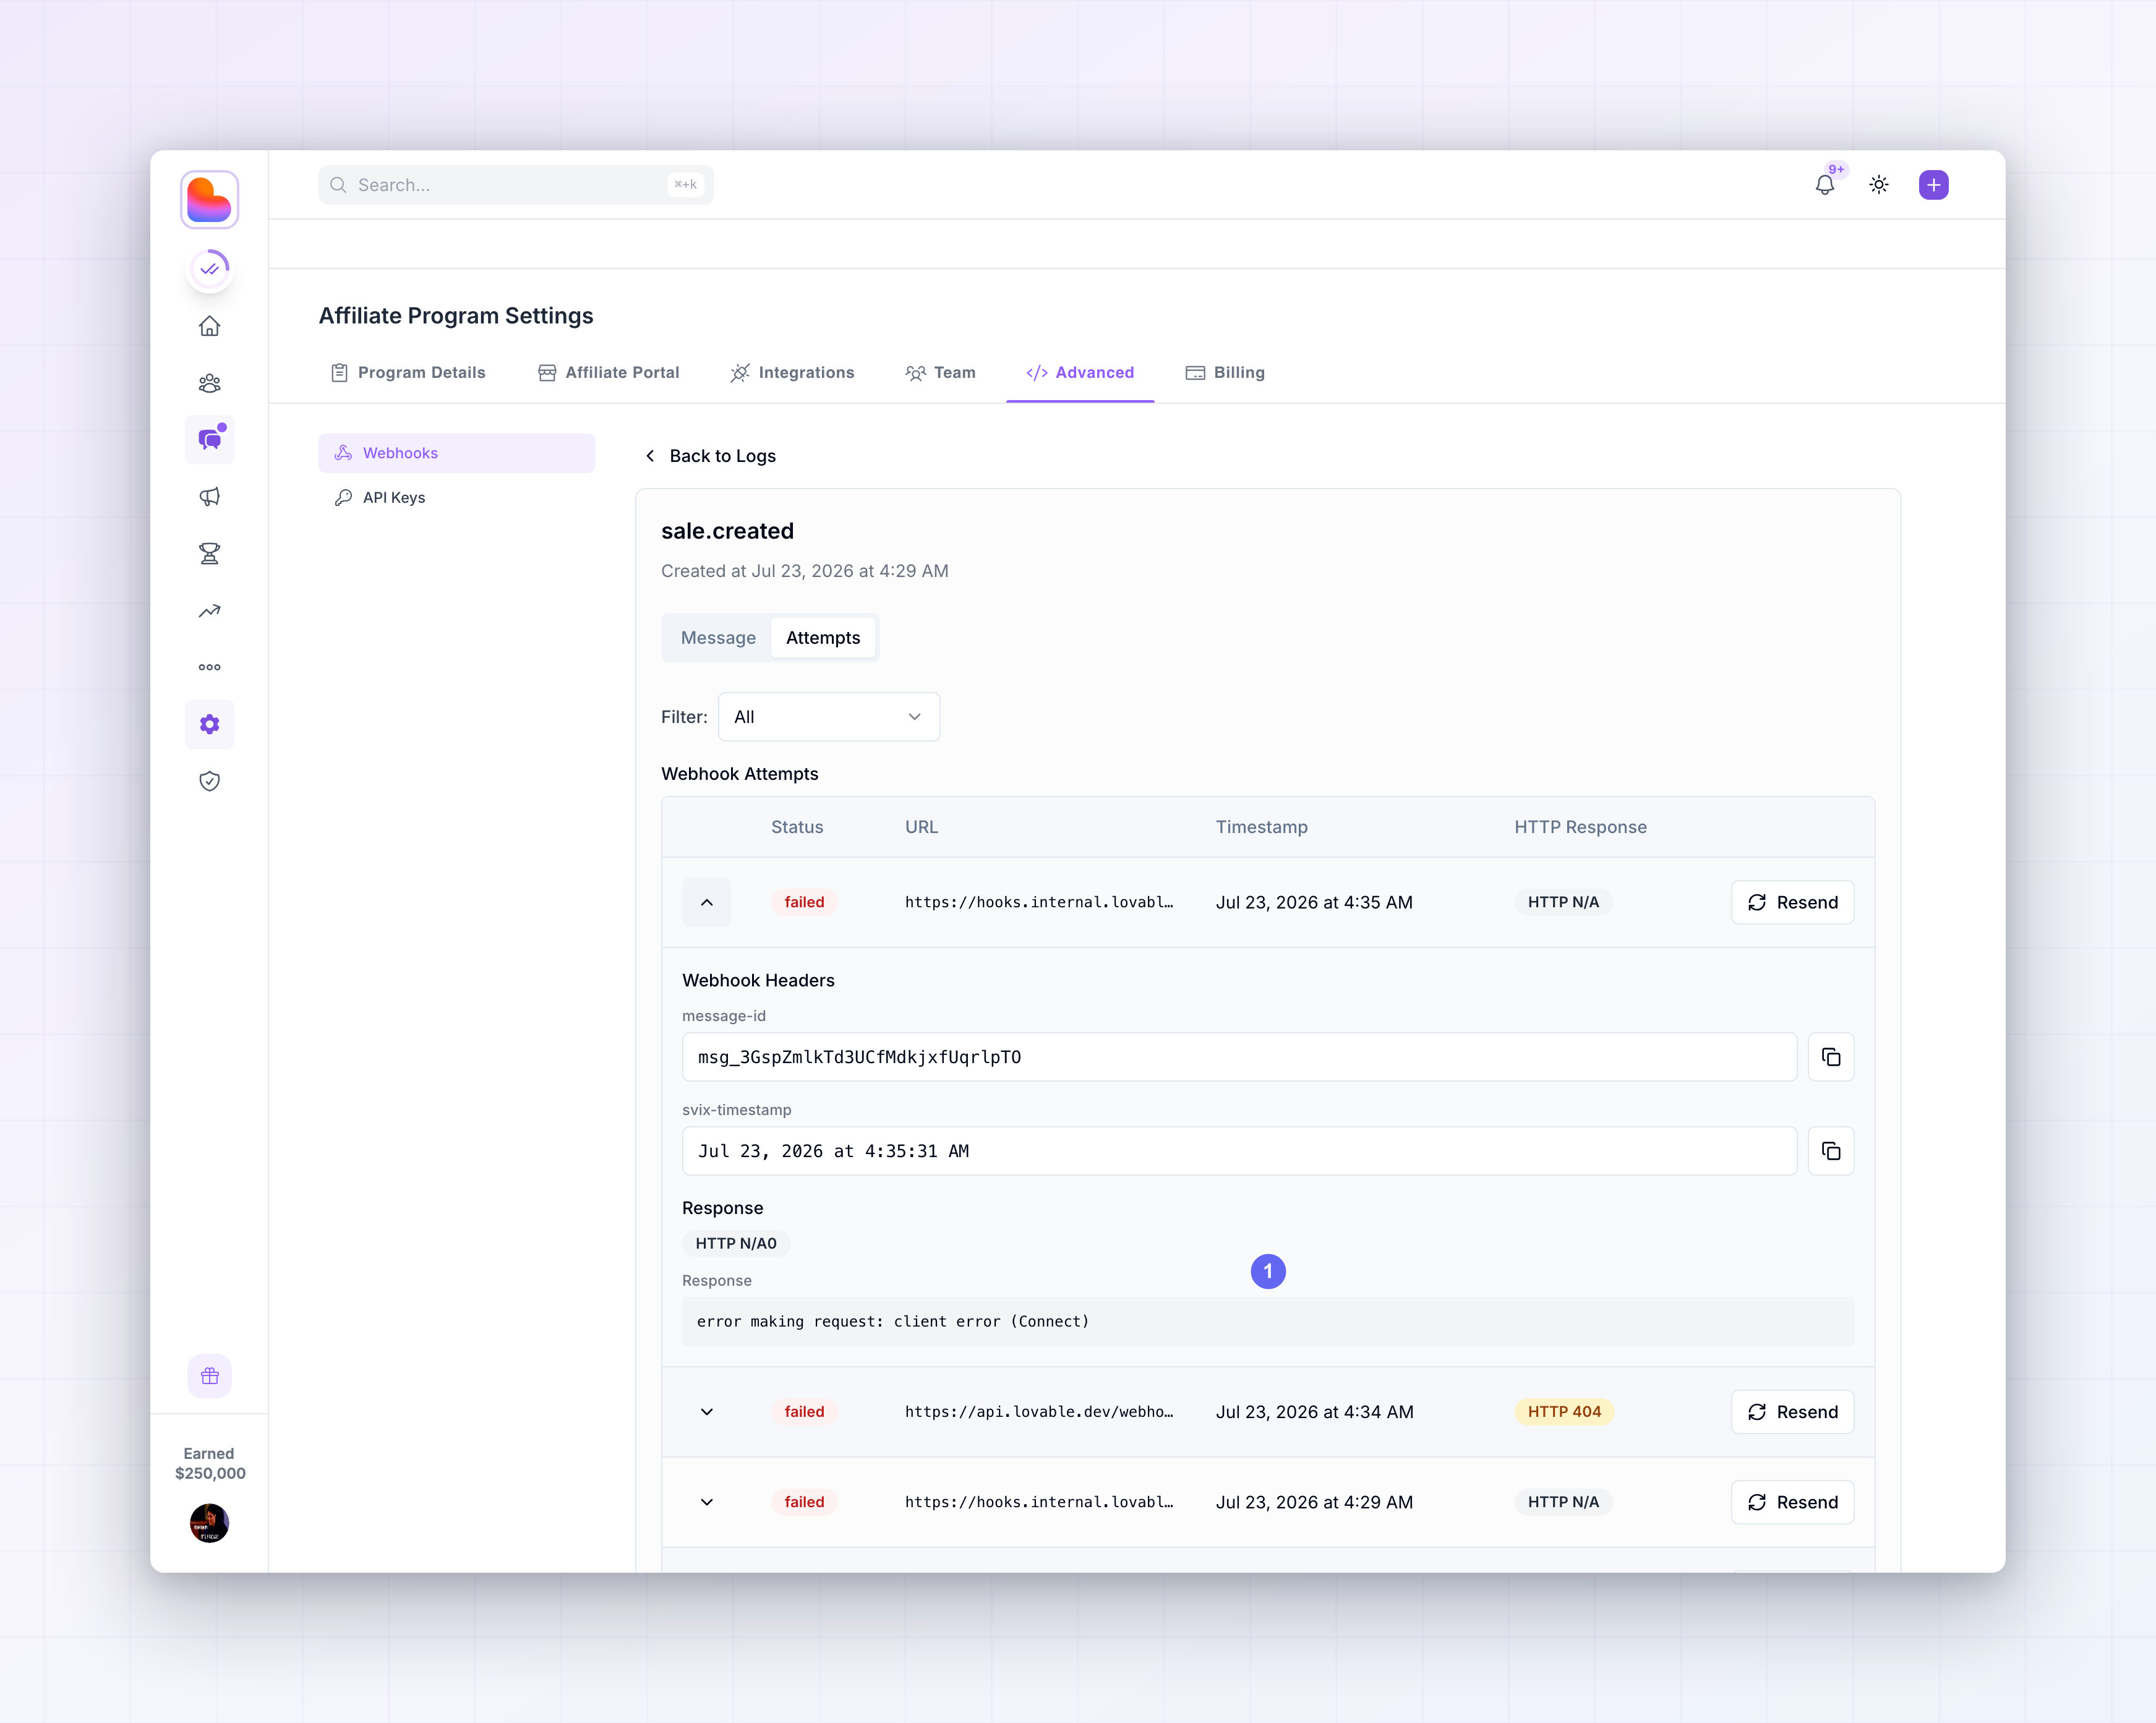 Expand an attempt with the chevron and you get the detail that matters most:
- Webhook Headers — the
message-idandsvix-timestampthat were sent, each with a copy button. - Response — the status code and the response body your server returned.
Resend a message
Resend appears in two places: on a row in the Logs list, and on each individual attempt in the Attempts tab. Both send the same message to the endpoint again, immediately. Resend when you have fixed the cause of a failure — a bug in verification, a downstream service that was down, an endpoint that was pointing at the wrong host. Resending against a handler that is still broken produces another failed attempt and another log row.Recent Activity per endpoint
The program-wide Logs tab covers every endpoint. To check one endpoint in isolation, open it from the Endpoints tab with View Details and look at Recent Activity on the Overview tab, which lists its last five deliveries with their status. Use it for a quick “is this endpoint healthy right now” check; use the Logs tab when you need history, filtering, or a specific message.Retries deliver the original payload
The payload is serialised once, when the event fires, and stored. A retry sends those stored bytes — it does not re-read the object. If asale.created fails at 09:00 and succeeds on the fourth attempt at 11:30, you receive the sale
as it was at 09:00. If the sale was edited or refunded in between, the payload will not show it,
though the subsequent sale.updated or sale.deleted event will arrive separately.
Where current state matters more than the state at event time, treat the payload as a notification
and re-read the object through the REST API before acting. See
Payload structure.
Be idempotent on svix-id
Retries and manual resends mean the same message reaches you more than once. This is not an edge case; it is normal operation, and any handler that writes data must tolerate it. Thesvix-id header is stable across every attempt and every resend of a message, which makes it the
natural idempotency key:
200 for a duplicate. Returning anything else marks the delivery failed and schedules another
retry of a message you have already processed.
Diagnose a failure
Work from the response body in the Attempts tab, then match it against the usual causes:
Once you have a fix deployed, resend from the log rather than waiting for the next natural event.
While you are iterating, the Testing tab sends a fresh signed delivery on demand — see
Test and replay.
Disabled endpoints
A disabled endpoint receives nothing. That applies whether you disabled it yourself from the … menu, or it was disabled after failing continuously for an extended period. This is the reason to disable an endpoint only for as long as you actually need to, and to prefer fixing the handler over disabling it. See Manage endpoints.Monitoring
The dashboard log is for investigating, not for noticing. Nothing alerts you when deliveries start failing, so build the noticing on your side:- Alert on your own handler. Count verification failures, exceptions, and non-
2xxresponses you return, and alert when the rate rises. You will see a problem there before it shows in the log. - Watch for silence. If your program normally records sales daily, an alert on “no
sale.createdprocessed in 24 hours” catches an endpoint that is quietly disabled or unreachable — a failure mode that produces no errors at all on your side. - Check the Failed filter after every change to your handler, your URL, your certificate, or your infrastructure. That is when things break.
- Store the message ID with the record you write. It turns “did we get this sale?” into a single lookup in both your database and the delivery log.
Related
Verify signatures
The most common cause of a log full of 400s.
Manage endpoints
Disable, re-enable, or repoint an endpoint.
Payload structure
What the stored Message Content contains.
Test and replay
Send a fresh delivery while you iterate on a fix.
Webhooks introduction
How deliveries work end to end.
Webhooks in the Help Center
The same screens, explained without code.